- Research
- Open access
- Published:
Towards precision medicine: discovering novel gynecological cancer biomarkers and pathways using linked data
Journal of Biomedical Semantics volume 8, Article number: 40 (2017)
Abstract
Background
Next Generation Sequencing (NGS) is playing a key role in therapeutic decision making for the cancer prognosis and treatment. The NGS technologies are producing a massive amount of sequencing datasets. Often, these datasets are published from the isolated and different sequencing facilities. Consequently, the process of sharing and aggregating multisite sequencing datasets are thwarted by issues such as the need to discover relevant data from different sources, built scalable repositories, the automation of data linkage, the volume of the data, efficient querying mechanism, and information rich intuitive visualisation.
Results
We present an approach to link and query different sequencing datasets (TCGA, COSMIC, REACTOME, KEGG and GO) to indicate risks for four cancer types – Ovarian Serous Cystadenocarcinoma (OV), Uterine Corpus Endometrial Carcinoma (UCEC), Uterine Carcinosarcoma (UCS), Cervical Squamous Cell Carcinoma and Endocervical Adenocarcinoma (CESC) – covering the 16 healthy tissue-specific genes from Illumina Human Body Map 2.0. The differentially expressed genes from Illumina Human Body Map 2.0 are analysed together with the gene expressions reported in COSMIC and TCGA repositories leading to the discover of potential biomarkers for a tissue-specific cancer.
Conclusion
We analyse the tissue expression of genes, copy number variation (CNV), somatic mutation, and promoter methylation to identify associated pathways and find novel biomarkers. We discovered twenty (20) mutated genes and three (3) potential pathways causing promoter changes in different gynaecological cancer types. We propose a data-interlinked platform called BIOOPENER that glues together heterogeneous cancer and biomedical repositories. The key approach is to find correspondences (or data links) among genetic, cellular and molecular features across isolated cancer datasets giving insight into cancer progression from normal to diseased tissues. The proposed BIOOPENER platform enriches mutations by filling in missing links from TCGA, COSMIC, REACTOME, KEGG and GO datasets and provides an interlinking mechanism to understand cancer progression from normal to diseased tissues with pathway components, which in turn helped to map mutations, associated phenotypes, pathways, and mechanism.
Background
Next Generation Sequencing (NGS) technologies open new diagnostic and therapeutic ways for cancer research. The resulting high-throughput sequencing data has to be processed in complex data analytics pipelines including annotation services. Unfortunately, there is not yet a well-integrated platform available for both clinical and translational [1–5] research to fulfill these annotation and analytical tasks. In addition, the large volumes and growing variety of NGS data sources pose another challenge, since the computational infrastructure for the biological interpretation will have to cope with very large quantities and heterogeneities of data originating from sequencing facilities [6–8]. More importantly, the functional annotation of genomics data for cancer has to take tissue-specificity into consideration and thus has to avoid ambiguity while consolidating and aggregating clinical outcomes from disparate resources. Similarly, a computational platform that can consolidate variety of data derived from electronic health records (EHRs), omics technologies, imaging, and mobile health is a fundamental requirement to accelerate the recent precision medicine initiative1 [9]. In our initial work [10] we presented an approach to link and query three large repositories – TCGA2, COSMIC3, and Illumina Human Body Map 2.04 – to analyse the expression of specific genes in different tissues and its variants by:
-
Linking of gene expression, copy number variation (CNV), somatic mutation data from two disjoint resources (i.e., COSMIC and TCGA).
-
Identifying sets of genes using the Illumina Human Body Map 2.0 with relevance for ovarian cancer with a comprehensive set of mutations.
In order to analyse the tumorigenesis of female gynecological cancer types, in this article we extend our previous work [10] by including:
-
Ovarian Serous Cystadenocarcinoma (OV), Uterine Corpus Endometrial Carcinoma (UCEC), Uterine Carcinosarcoma (UCS), Cervical Squamous Cell Carcinoma and Endocervical Adenocarcinoma (CESC) datasets.
-
Methylation data to further understand potential promoter genes based on methylation change and biomarkers.
-
REACTOME, KEGG and GO biological processes datasets to understand cancer causing gene regulation through associated pathways and biological processes.
To further understand the epigenetics, we retrieved the genomic positions (loci), mutation frequency, change in promotor methylation for each gene in the above four cancer types (OV, UCS, UCEC, & CESC). These are further classified by biological processes involved in understanding the mechanism and associated pathways. By doing this we explore the variant and mutation prioritization using 16 different tissue types reported in the Illumina Body Map 2.0. The differential expressed genes derived from Illumina Human Body Map 2.0 – using the procedure suggested by Trapnell, C. et al. [11] – are linked with different tissue types and gene expressions in COSMIC and TCGA datasets leading to a potential biomarker for a particular tissue-specific cancer.
The proposed approach enriches mutations and methylation by filling in missing links from COSMIC, TCGA, REACTOME, KEGG and GO datasets providing a mechanism to analyse cancer progression from normal to diseased tissues with key pathway components. Our key objective is to understand the tumorigenesis of these four gynecological cancer types (OV, UCS, UCEC, & CESC). In order to retrieve the patterns of genes and tissue-specific information from various cancer mutations reported in multiple repositories; we encountered three computational challenges for linking and querying these multiple distributed repositories: (i) transform heterogeneous data repositories and their storage formats into standard RDF; (ii) discovering links by finding specific patterns, i.e., correlations for a gene with regards to CNV, mutation, gene expression, and methylation datasets; and (iii) scalable querying over the large volume datasets covering 16 different tissue types and the gene expression data from different repositories. We propose a data-interlinked platform called BIOOPENER5 that enables automated discovery of data linkages and querying of information from large-scale cancer and biomedical repositories.
The experiments conducted in this paper is aligned to the transcriptome and epigenetics studies based on the Human Body Map 2.0 (HBM) from Illumina which covers the following tissues: adrenal, adipose, brain, breast, colon, heart, kidney, liver, lung, lymph, ovary, prostate, skeletal muscle, testes, thyroid, and white blood cells. The HBM provides gene-specific information across one or more tissue types and intends to support the identification of potential biomarkers for a targeted therapy. In this study, our results not only discover novel biological outcomes but also provides a linked datasets that assimilates clinical outcomes from related data repositories.
The rest of the paper is structured as follows: “Motivation” section motivates our working scenario based on Illumina Human Body Map (HBM) 2.0, cancer and biomedical databases (COSMIC, TCGA, REACTOME, KEGG and GO); “Methods” section presents the BIOOPENER methodology and architecture; “Results” section discusses the results obtained from the BIOOPENER platform; “Related work” section presents the related work in linking and querying cancer genomics repositories; and “Conclusion” section draws the conclusion from our work.
Motivation
In order to understand the tumorigenesis, it is one approach to compare normal and diseased tissue samples to interpret the changes in the expression patterns of the genes with regards to the observed disease status. In our case, Illumina Human Body Map (HBM) 2.0 serves the purpose to identify similarities in gene expression patterns using the studies across different tissue types, where HBM discloses the similarities between human tissues on the molecular and genetic level. Due to overlaps between cancer behaviors, progression, and mutated genes, we have selected top 1006 genes by a filtering criteria based on the Reads Per Kilobase of transcript per Million mapped reads (RPKM) values. Further, these top 100 genes identified are linked using the genetic features such as genomic loci (start, end), beta value, cell cycle etc. from previously observed studies in COSMIC and TCGA repositories. The work presented in this article covers only non-synonymous (NS) mutations. Since many somatic mutations are passenger – synonymous mutations – and do not impact tumorigenesis, we first select those genes that are more likely to be drivers. The selection of driver genes is based on the mutations frequency (RPKM value).
Illumina Human Body Map (HBM) 2.0: HBM covers data from transcriptome studies for 16 tissue types. Samples for these 16 tissue types have been processed, aligned and finally expression level have been determined [12]. Sequencing has been performed to provide both paired-end and single-end libraries (read-length of 50bp and 75bp). A list of differentially expressed genes are extracted using the step 2 (assemble expressed genes and transcripts) of procedure suggested by Trapnell, C. et al. [11]. The gene expression data extracted from HBM samples returns a very large list of more than 52000 genes. For data processing reasons we chose to reduce the list and therefore defined the cut-off for each RPKM value according to the method suggested by Sandberg et.al [13]. As a result, the data for each tissue type includes both the coverages and the RPKM values as the corresponding expression level. The RNA seq dataset provides additional relevant data such as CNV, fusion genes, structural variation, differentially expressed genes, novel mutations, splice junctions and transcriptome variations [14].
Annotation Databases (COSMIC & TCGA): he main focus of this work is the identification of patterns for cancer mutations and globally known mutations and their types for selected differentially expressed genes across different tissue types. Figure 1 shows the correspondences, i.e., the associations or links that have been established between the TCGA and COSMIC databases for this purpose. For this task, our primary concern has been the associations between the CNV, the known mutations, and the gene expression data.

Links between COSMIC and TCGA datasets
As part of our initial work [10], we have identified instances to link in the COSMIC and TCGA datasets (see Fig. 1). For example, GENE_NAME is used to establish links between COMPLETE_MUTATION and GENE_EXPRESSION datasets between both the repositories. Similarly, GENE_NAME and HUGO_SYMBOL has been used to link COMPLETE_MUTATION from both the datasets. Further, CNV datasets from COSMIC and TCGA have been linked based on chr:start_end position. From the computational perspective, the links (owl:sameAs) between COMPLETE_MUTATION and GENE_EXPRESSION datasets using the GENE_NAME property allow to create a subset of driver genes from a larger complete set of mutations.
Annotation Databases (REACTOME, KEGG, & GO processes): We observe a set of prospective links through the DNA methylation datasets – from COSMIC and TCGA – to GO proliferation Ids. These links broaden our understanding of the cell proliferation (with frequently mutated genes) where changes in methylation level regulate the gene expression. In order to target certain genes, it is important to find the affected cancer types and the common pathways associated with the cell proliferation. The KEGG and REACTOME datasets provide additional links to identify genetic profiles from already identified mutations in COSMIC and TCGA datasets. Clinical variations of any mutation from the REACTOME dataset will help to explore clinical relevant targets, effects of down-regulation of each pathway and alternate pathways for the cell.
Figure 2 shows a set of prospective owl:sameAs links between COSMIC, TCGA, REACTOME, KEGG, GO datasets. For example: (i) if “Gene Symbol” used in the TCGA gene expression gets linked (through owl:sameAs) with the “Gene Symbol” of COSMIC methylation datasets, then a simple query can fetch result about the changes in a promotor region associated with mutations already identified in TCGA and COSMIC datasets; (ii) similarly, “ENSEMBL ID” used in COMSIC, TCGA, and Gene Ontology datasets can be linked to obtain the transcript level changes with mutated gene in order to understand the disease progression; (iii) finally, by linking COSMIC and TCGA “Methylation” datasets provides us the measure of beta value changes, the responders, and non-responders based on hyper and hypomethylation. In our initial work [10], we have identified MYH7 as one of the potential biomarker based on copy number variation (CNV) frequencies. In this article, we are aiming to link the identified mutations (from COSMIC & TCGA) across KEGG, REACTOME, and GO datasets to understand the metabolic process of each reaction and the localization of each component of a reaction further connecting the metabolic process to pathways described in the KEGG dataset.

Links between COSMIC, TCGA, REACTOME, KEGG, and GO datasets
Methods
The BIOOPENER approach is fundamentality similar to the Bio2RDF7[15, 16] framework that created a mashup of linked data connected through various linking properties (e.g., xRef, owl:sameAs, x-relation) [17]. BIOOPENER focus is specifically around discovering and exploiting the owl:sameAs links for constructing complex federated queries – due to the precise owl:sameAs semantics [18] – across multiple datasets. We now present the BIOOPENER’s architectural, linking, and querying methodology.
BIOOPENER architecture
The BIOOPENER architecture is summarized in Fig. 3 showing all three major components. First, the RDFization component that generates Linked Data from the COSMIC, TCGA, REACTOME, KEGG, GO databases results into several SPARQL endpoints. It is important to note that, the two datasets (COSMIC and TCGA) are converted from the raw format to RDF; further, we linked COSMIC and TCGA to REACTOME8, KEGG9, and GO10 datasets hosted at the Bio2RDF11. Second, the linking component searches and discovers links between selected datasets. The links discovered by this component have an effect on the efficiency of the source selection, on the query planning, and on the overall query execution over distributed SPARQL endpoints. Third, the scalable query federation component: it a single-point-of-access through which distributed data sources can be queried in the concerto.

BIOOPENER: Linking & Querying Cancer Genomic Resources
The scalable query federation is based on the SPARQL query federation engine called SAFE [19], which has been developed for accessing distributed clinical trial repositories. SAFE provides a single-point-of-access through which distributed data sources can be queried in unison. SAFE has been adapted to improve the efficient integration of data from the different COSMIC, TCGA, REACTOME, KEGG, GO SPARQL endpoints. More specifically, SAFE makes use of a favorable distribution of data to reduce the number of sources required for processing federated SPARQL queries (without compromising recall). SAFE retrieves results from the large-scale repositories by (i) efficient source selection as per the capabilities of genomics repositories; (ii) query planning mechanism to decompose a query and build resultant data set from several sub-queries; (iii) query optimisation to execute the sub-queries; and (iv) query execution mechanism retrieve and integrate results. This approach is based on the principle that integrated data sources allow querying of multiple data sources in a single search, independently of their status being distributed or centralized, whereas traditional methods of data integration rather map the data models to a single unified model.
RDFization
The raw data files – of COSMIC and TCGA repositories – are available in the tab separated text (tsv) format, which are transformed into the RDF format using our in-house RDFizer tool that generates the N3 triples. The transformed RDF data from each cancer type are hosted as different SPARQL endpoints. The four types of data have been included from COSMIC, i.e., gene expression, gene mutation, CNV, and methylation. From TCGA we have RDFized three types of data, i.e., CNV, gene expression and methylation for four cancer types, namely Ovarian Serous Cystadenocarcinoma (OV), Cervical Squamous Cell Carcinoma and Endocervical Adenocarcinoma (CESC), Uterine Corpus Endometrioid Carcinoma (UCEC) and Uterine Carcinosarcoma (UCS). Table 1 shows the overall statistics of the RDF datasets: row 1 represents for the COSMIC gene expression data the corresponding triples generated (column 3), the number of subjects (column 4), the number of predicates (column 5), the number of objects (column 6) and it’s RDF data size (column 7). Rows 2-4 represent the same type of data for the COSMIC gene mutation, CNV and methylation data, respectively. A total of 154 million records has been RDFized, producing approximately 1.2 billion triples, for COSMIC datasets. Row 5-8 represents the statistics for the RDF version of TCGA-OV, TCGA-CESC, TCGA-UCEC, and TCGA-UCS, respectively. Rows 9-10 represent the RDF data statistics for KEGG, REACTOME and GOA datasets, respectively. These three datasets are external as we have not transformed them into the RDF format but instead used the already available RDF versions from Bio2RDF.
Linking
We propose a linked data based approach to create correspondences (links) between dispersed cancer and biomedical datasets. These datasets contain rich information and helpful in answering the biological questions targeted in this article. These links, once identified and established, will sustain and support the query federation over distributed repositories (discussed in the “Scalable query federation” section).
COSMIC and TCGA linking: we perform linking of the COSMIC and TCGA datasets. We have employed the owl:sameAs construct to establish links across entities based on the semantic properties highlighted in Fig. 1. For example, the entities that contain information about Gene Symbol, TCGA_ID, ENSEMBL ID have been linked using owl:sameAs. An example link between COSMIC and TCGA is shown in the Listing 1, where two COSMIC sample ids have been identified as being identical to two TCGA patient bar code ids.

The example links generated in our use-case are shown in the Fig. 4. The COSMIC and TCGA datasets have been integrated using the owl:sameAs construct. For instance, MYH7 (which is an RDF resource of type Gene Symbol) in both COSMIC and TCGA datasets is linked using owl:sameAs. To understand the promotor genes and their deviation, the methylation datasets of COSMIC and TCGA are linked to retrieve beta values for a given set of CNVs. For instance, cg00000292 which is an RDF resource of type “Composite Element REF” in both COSMIC and TCGA datasets have been linked using owl:sameAs. Similarly, Fig. 4 shows the owl:sameAs links between COSMIC and TCGA datasets for TCGA-13-0920 and TCGA-24-1850 (RDF resources of type Sample_ID).

Example Links between COSMIC, TCGA, KEGG, REACTOME, and GO Datasets
Linking COSMIC and TCGA with REACTOME, KEGG, & GO: We link COSMIC and TCGA with Gene Ontology (GO) datasets to understand the biological processed involved with each mutation or CNVs and the underlying impact of these mutations on cancer and healthy cells. From the Fig. 4, it is evident that we have linked ENSMUSP00000018795 – which is an RDF resource of type Ensemble ID – in COSMIC dataset with the similar resource in GO dataset. This will help in retrieving the gene behavior of healthy cells (from Illumina Body Map) compared to the diseased TCGA samples by tracking the GO process involved in the oncogenesis. By enabling links between COSMIC and GO datasets, we are now able to find links across Reactome and KEGG datasets. This will allow tracking the changes in healthy cells based on their pathway activities to identify the disease and biological process related pathways. For instance, the “Ensemble ID” from COSMIC is linked with the “Ensemble ID” in GO dataset providing us the GO processes and the GO IDs associated with these processes. These are further linked with their respective KEGG and Reactome IDs. The linking across these datasets are shown in Fig. 4.
The number of links generated in case of COSMIC and TCGA datasets, and the number of identified links between KEGG, GO, and Reactome datasets are shown in the Fig. 5. For instance, a total number of 121916 links are generated in COSMIC to link them with TCGA. Similarly, 46112 links are generated to integrate TCGA with TCGA Methylation datasets, 891612 links are generated to link TCGA Methylation dataset with GOA (Gene Ontology Annotation) dataset, and 41424 links are generated to integrate TCGA Methylation dataset with Reactome.

Link Statistics
On the other hand, we identified a total of 1049858 existing links – within Bio2RDF – between GOA and GO datasets. A total of 1810 outgoing links to KEGG from GO and 7359 incoming links to GO from KEGG were identified. A total of 28808 links were discovered between GO and Reactome datasets.
Scalable query federation
We have developed a query federation engine – called SAFE — for accessing sensitive clinical data at different locations [19]. Two main changes have been introduced to SAFE for efficiently querying the COSMIC, TCGA, KEGG, Reactome, and GO SPARQL endpoints. First, standardise RDF query representation: in the initial version [19], SAFE issues queries for statistical clinical information stored within distinct names graphs for RDF data cubes [20]. Therefore, the internal query processing (i.e., source selection, query planning, query execution) had to be adapted to query the regular RDFized versions of the COSMIC, TCGA, KEGG, Reactome, and GO datasets. Second, access control had to be disabled: SAFE imposes restrictions for data-access as a feature (defined as Access Policy Model [19]) while federating queries over multiple clinical sites, i.e., imposing the data restrictions for different data repositories. Since experiments conducted in this paper mainly involve public repositories this feature has been disabled.
Figure 3 shows SAFE’s three main components within the BIOOPENER platform: (i) Source Selection: performs multilevel source selection based on the capabilities of data sources; (ii) Query Planning: filters the selected data sources based on access rights defined for each user; and (ii) Query Execution: performs the execution of sub-queries against the selected sources and merges the results returned.
Source Selection: SAFE performs a tree-based two-level source selection as shown in Fig. 6. At Level 1, like other query federation engines [21–23], we do triple-pattern-wise endpoint selection, i.e., we identify the set of relevant endpoints that will return non-empty results for the individual triple pattern in a query. At Level 2 (unlike other query federation engines), SAFE performs triple-pattern-wise named graph selection, i.e., we identify a set of relevant named graphs for all relevant endpoints already identified at Level 1. SAFE relies on data summaries to identify relevant named graphs.

Tree-based two level source selection
Query Execution: The Listing 2 shows an SPARQL query, which federates across COSMIC and TCGA data asking for genomic loci of a mutated gene by chromosome start points which then returns the disease metastasis information along with the mutation type. Answering such a query requires the integration of COSMIC with TCGA and merging results from both TCGA and COSMIC, and thus has to make use of query federation. The results for the first four triple patterns in the given query (i.e., cosmic:sample, cosmic:gene, cosmic:start) are fetched from COSMIC and the results for the next four triple patterns (i.e., tcga:hybrid_ref, tcga:gene, tcga:start) are fetched from TCGA. Further, both results are merged on the basis of the last triple pattern (gene_c owl:sameAs gene_t) which integrates COSMIC with TCGA. Sample results for this query can be seen in Fig. 9.

In our initial work [10] we queried mutations and CNV data to identify the novel mutations and their somatic behavior from healthy to cancer cells. The Listing 3 shows a SPARQL query, which extracts promoter level changes occurred due to mutations extracted from query shown in the Listing 2. This requires linking across the COSMIC and TCGA Methylation datasets. The first three triple patterns fetch data from COSMIC and the next three triple patterns fetch data from TCGA. The last triple pattern provides a link – owl:sameAs between genes – for merging data from both the data sources.

The SPARQL query listed in Listing 4 have covered 3 distinct sources, i.e., methylation from TCGA and COSMIC datasets with associated Gene Ontology Annotations (GOA). TCGA provides the changes in methylation per composite element, whereas in COSMIC we have such changes on the gene level. To retrieve both the gene and promoter level information, we have queried genes from both data sources and extracted all the promoter regions. Once the promoter regions are identified, it is essential to understand the processes involved in these regions. This helped us to query GOA for extracting the processes on the promoter and gene levels. If a gene level change do not comply with promoter level changes, it is an indication of what processes of the gene have mutated them. Such results can be obtained through a federated query with three data sources, i.e. COSMIC, TCGA, and GOA. The Listing 4 provides an example federated query where the first three triple patterns are answered from COSMIC, the next three triple patterns are answered from TCGA and the seventh triple pattern merges result obtained from COSMIC and TCGA through gene. The eighth and ninth triple patterns fetch data from GOA which is finally merged with COSMIC and TCGA datasets using the gene information.

The SPARQL query shown in Listing 5 finds associations between the genes, pathways and biological processes. We queried the healthy genes from Illumina Body Map against all mutations obtained from TCGA and COSMIC to find their DNA and promoter level methylation changes. In order to explore the gain and loss on a disease at the phenotype level, we have included KEGG and REACTOME sources which map each discovered gene with its biological process for phenotype and process driven pathways. The Listing 5 shows a federated SPARQL query, where the first three triple patterns are answered from TCGA; and the next five triple patterns fetch and merge data from REACTOME and GOA. The last five triple patterns obtain results from KEGG and merge them with the rest of results.

The Listing 6 retrieves the methylated promotor regions. The query shown in Listing 6 extracts the location of methylation based on the input genes, composite element REF (promotor region) and chromosome number. For instance, we have queried MYH7 (gene) for promotor region cg05744229 at the chromosome 14 (region of methylation) and extracted two promotor regions from TCGA and COSMIC with the start value of DNA promotor range such as 23904678 (TCGA) and 23435469 (COSMIC).

Listing 7 shows an example federated SPARQL query derived from the Listing 2 for a specific gene, namely MYH7. Similarly, we have executed the federated queries shown in the Listings [2-6] for each of the hundred (100) genes extracted from the Illumina Body Map, mentioned above.

The query execution time for these gene-specific queries is shown in the Table 2. The “Query” column lists individual queries (e.g., listings [2-6]), “QE Time”, “Results (No. of Triples)” and “Datasets” columns show the query execution time in millisecond (msec), number of triples returned as a result and the datasets required for executing individual queries.
Results
We analyse the genes having RPKM value > 0.3747 and differentially expressed in all tissue types. Figure 7 shows a list of 100 genes retrieved from the HBM datasets, which are highly expressed in 16 different tissues. We have identified potential cancer types based on the gene patterns for different tissues that helped further to understand the behavior of most amplified cancer types. The overall goal of this study is to understand the relevance and association of mutation, genes expression, and promoter region by:
-
Analysing the normal tissues expression levels, enriched and affected pathways along with their associated expression levels and changes obtained from the HBM 2.0 datasets.
Fig. 7 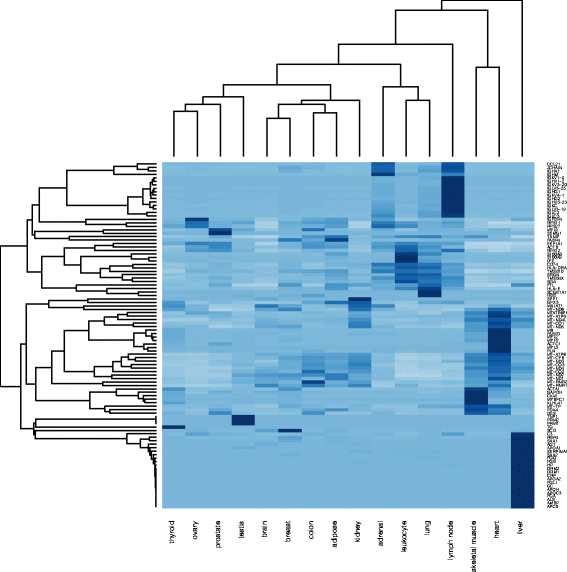
HBM: List of genes expressed in all tissues and highly expressed
-
Analysing the normal tissues expression levels against the somatic mutations linked and retrieved from the COSMIC and TCGA datasets.
-
Classifying the mutations obtained from above two steps in terms of biological processed and pathways from GO, KEGG, and REACTOME

We now discuss and analyse the results obtained from the BIOOPENER platform through linking and querying the cancer and biomedical repositories.
Analysis: HBM, COSMIC, and TCGA
Initially, we have selected top 100 genes that are highly expressed in all 16 tissues as shown in the Fig. 7 to (i) retrieve their CNV, mutation, gene expression and methylation annotations from cBioPortal12; (ii) retrieve methylation from CNV annotator13 and UCSC Cancer Genomics Browser14; and (iii) retrieve mutation datasets from TCGA [24]. The results from TCGA (Fig. 8) clearly indicate a mutation frequency elevated distribution of these genes in UCS, CESC, UCEC and OV cancers. In Fig. 8 we observe average percentage case mutations in the UCS, UCEC, CESC and OV cancers are 87.5%,58.3%, 57.6%, 81.4% respectively. This outcome justifies the selection of UCS, UCEC, CESC and OV as good candidates for further investigation due to its elevated amplification rate and its multiple repetition in different experiments.

TCGA query output from cBIO Portal (Blue:Deletion, Red:Amplification, Green:Mutation, Brown:Multiple Alterations) [43]

Linked annotations for MYH7 - COSMIC
This study targets genes based on their contribution in mutations15, the listing 8 shows the highly relevant driver genes transforming healthy human tissues into diseased ones for respective cancer types.

The overlap and frequency among these four cancer types results into the discovery of top 20 biomarkers shown in the listing 9). Table 3 shows the potential chromosome locations chr14,chr5,chr6,chr19 and genes TG,TXNIP,GC,MYH7 with high relevance in the progression of four gynecological cancer types.

Figure 9 shows the COSMIC and TCGA annotations. The CNV datasets doesn’t use “Gene symbol” property (or predicate) and it is important to map (or link) genome regions with gene symbols to retrieve CNV information from different datasets. We implemented a linking rule based on the chr_no,chr_start and char_end properties (or predicates) to retrieve the CNV information across datasets to identify genes within the extracted loci. Result of this annotation are shown in the Table 3. It is evident that the MYH7 gene has many copies reported in the COSMIC datasets as well as in the TCGA datasets suggesting it a potential biomarker for four gynecological cancer types. The TG and MYH7 genes are highly mutated as they are repetitively appearing on multiple chromosomes. For instance, MYH7 primarily carried the LOSS type of a mutation for chr14 which is a dominant mutation with all its regulation of over, under and normally expressed. Translational researchers may want to repeat and re-validate the study for Pubmed ID:1398522 with the beta value – as a measure of methylation – of 0.041999536. The scaled estimation (Tumour purity) of 773.555 supports this gene (MYH7) from the methylation aspect to detect promoter level changes in the four cancer types. Further multiple genomic locations will help clinical practitioners to find a potential CNV for a targeted study ultimately helping towards a better prognosis.
Figure 10 shows the annotation of twenty (20) discovered biomarkers (genes) where promoter level changes are occurring on the extreme changes of -ve or +ve beta-values in all the four cancer types studied in this article. The most affected genes due to these promotor level changes are: MYH7, TG, DLC1, S100A8. As reported in our initial work [10] major changes are occurring nearby -0.773 beta-value and their corresponding composite element reference ids are cg01429391, cg05744229, cg26670875, cg18205205, cg21242212, cg08240074, cg13785779, cg05744229. Most of these changes are occurring around chromosome 1 and 14 and 5’ UTR. Next section discusses the mechanism behind these changes and their pathway analysis.

Promotor level methylation changes in biomaker genes
Analysis: GO, KEGG and REACTOME
We have identified twenty (20) genes in terms of mutation frequencies and CNV together with the promoter level changes in methylation data. However, we are unaware of the mechanism involved in combined effects of these twenty (20) genes. We have queried linked pathways and coalitions over the GO, KEGG, and REACTOME datasets. Figure 11 – snippet generated from ClueGO [25, 26] – shows the muscle filament sliding pathway as a key in rare cancer types such as retinoblastoma where effective “actin” filament formation with Myosin (MYH4) is a prime regulator [27]. Our approach has identified “actin (ACTA1)” and “myosin (MYH7)” combination with “MYBPC1” as the potential pathways causing promoter changes in gynecological cancers. It’s evident that alterations in the activity and/or expression patterns of actin-bundling proteins could be linked to the cancer initiation or progression [28]. Haitian Lu, et al. suggests that the acute inflammatory response is associated with cancer development because inflammatory micro-environment inhabits various inflammatory cells [29]. A network of signaling molecules are indispensable for the malignant progression transformed cells attributed to the mutagenic predisposition of persistent infection-fighting agents at the sites of chronic inflammation causing cancer development in various tissues [29]. In our case, the reason behind significant methylation changes associates with the pathway peptidyl-cysteine s-nitrosylation. The dysregulation of s-nitrosylation in severe pathological events including cancer onset, progression, and treatment resistance leads to controlled epigenetic and treatment response [30]. Figure 10 explains the gene associated with each pathway and their contribution for OV, CESC, UCS, and UCSC cancer types. In this article, we demonstrated that well-connected datasets allow to construct complex biomedical queries (e.g., listings 2-6) covering variety of genetic and biological features (cnv, gene symbol, methylation, cell cycle, protein, pathway, etc.) that can span through broad range of multiple repositories.

Three pathways causing promoter changes in four gynecological cancer types
Related work
Kandoth et al. [31] performed a cancer study with 12 cancer types to enable logical classifications for the large amount of data generated by TCGA and ICGC. Saleem et. al. [32] have covered TCGA database with few cancer types and for a limited number of patient data. Similarly, a reduced version of the COSMIC database has been RDFized to explore on the mechanism of TP53 [33]. The federation platform [34] called “TopFed” is being developed to measure the query execution time on TCGA data set, which then has been further extended to cover the biological outcomes identified from Medline abstracts [35]. A similar platform such as FIREBROWSE16, Web-TCGA [36], and PCAWG17 have been built for TCGA dataset covering a wide range of genomic signatures and pan-cancer analysis. Gene and methylation annotation platforms such as omics4tb18 and Genevisible [37] help to decipher individual genes and their association annotated from TCGA. From the computational perspective, our goal is not to create yet another repository (or database), but to link the already existing ones for use in various analytical methods. We demonstrated that well-connected datasets allow to construct complex biomedical queries (e.g., listings 2-6) covering variety of genetic and biological features (cnv, gene symbol, methylation, cell cycle, protein, pathway, etc.) that can span through broad range of multiple repositories. The enrichment/linkage between COSMIC and TCGA datasets had been crucial to identify novel mutations. The approaches taken in DoCM [38], ICGC [39], and DIRECT [40] are complementary to our work in the sense that, discoveries suggested by the BIOOPENER platform are the most likely mutations/genes/pathways which can be further validated through creating links with the “well-curated” repositories (DoCM, ICGS, and DIRECT). Such validation is outside the scope of this article; however, we do plan to include “well-curated” databases in the next phase of BIOOPENER project. Similarly, we plan to extend linking with the ICGC [39] datasets that contains primary and blood samples providing further insight into the metastasis of primary tissues. Our current work covers copy number variation (CNV), genes, somatic mutation, and promotor methylation which targets highly mutated genes (on different tissues) and associated pathways. As far as we know, the work presented in this article is one of the first initiatives in discovering biomarkers and pathways for female gynecological cancer types covering five large-scale cancer and biomedical repositories.
Discussion
As discussed above, the NGS technologies are producing a massive amount of sequencing datasets [5, 8]. A top-up of approximately 40 petabytes of genomic information every year is foreseen from a wide variety of data sources published by human genome research centers worldwide [41]. Often, these datasets are published from isolated and different sequencing facilities. In cancer genomics, description of biological and genetic entities are available in several overlapping and complementary data sources containing complex genomic features, studies, and associations of such features [17, 42]. In order to understand the tumorigenesis, it is often the case that several genetic features, diseases, medical history, etc. are studied together, therefore, one of the key challenge in cancer genomics – a cornerstone of precision medicine – is to discover gene-disease-drug data links and associations which may provide novel insight into new drug development techniques tailored specific for an individual patient (or a group of patients) targeting prevention, diagnosis and treatment of the diseases.
In cancer genomics field massive amount of data exist with complex associations. To understand these complex associations, it requires to fetch all possible gene-disease-drug combinations, for instance:
-
Multiple pathways are involved to translate a particular gene
-
A single disease can be treated by eliminating effect of the combination of multiple drugs
-
Selection of these drugs is majorally based on the inhibitors (i.e., combination of gene-pathways)
-
Effect of one pathway alteration can change the modification of single gene and yields into multiple genes
In this article, we aimed to understand the associations between genetic, cellular and molecular features across isolated cancer datasets giving insight into cancer progression from normal to diseased tissues. Correlation of genes in OV, UCS, UCEC, & CESC clearly indicates that gynecologically induced cancers do have common mechanism and overlapping pathways. Which means, a drug created for one cancer type has a higher probability to be effective for other associated cancer types.
Conclusion
In this paper, we have presented a data-interlinked platform called BIOOPENER which enables querying different types of mutations and genomic alterations to contribute to molecular and clinical insights of cancer by defining most relevant variants and their prioritization. This knowledge could be highly advantageous for a targeted therapy and precision medicine based on gene expression data. The presented experiments are based on COSMIC, TCGA, REACTOME, KEGG, GO and HBM 2.0 datasets and have been used to identify sets of genes with relevance for four female gynecological cancer types - Ovarian (OV), Uterine Corpus Endometrial Carcinoma (UCS), Uterine Carcinosarcoma (UCEC), Cervical Squamous Cell Carcinoma and Endocervical Adenocarcinoma (UCES) - covering the 16 healthy tissue-specific genes from Illumina Human Body Map 2.0. We discovered 20 biomarkers (genes) in terms of mutation frequencies and CNV along with the promoter level changes in methylation data. We discovered three potential pathways causing promoter changes in gynecological cancers. In future, we plan to extend by covering the breast cancer type including additional genomic signatures, e.g., fusion gene, structural variations.
Endnotes
1 http://www.nature.com/nature/journal/v537/n7619_supp/full/537S49a.html.
2 https://tcga-data.nci.nih.gov/tcga/.
3 http://cancer.sanger.ac.uk/cosmic.
4 https://www.ebi.ac.uk/gxa/experiments/E-MTAB-513.
5 http://bioopenerproject.insight-centre.org.
6 https://github.com/yasarkhangithub/BioOpener/blob/master/Top_100_Gene_List.txt.
8 ftp://ftp.ebi.ac.uk/pub/databases/RDF/reactome.
9 http://download.bio2rdf.org/release/3/kegg/.
10 http://download.bio2rdf.org/release/3/goa/.
12 http://www.cbioportal.org/.
13 https://omictools.com/cnv-annotation-category.
14 https://genome-cancer.ucsc.edu/.
15 https://github.com/yasarkhangithub/BioOpener/blob/master/Mutation_Key_Genes_Cancerwise.xlsx.
References
Xuan J, Yu Y, Qing T, Guo L, Shi L. Next-generation sequencing in the clinic: promises and challenges. Cancer Lett. 2013; 340(2):284–95.
Ulahannan D, Kovac MB, Mulholland PJ, Cazier JB, Tomlinson I. Technical and implementation issues in using next-generation sequencing of cancers in clinical practice. Br J Cancer. 2013; 109(4):827–35.
Simon R, Roychowdhury S. Implementing personalized cancer genomics in clinical trials. Nat Rev Drug Discov. 2013; 12(5):358–69.
Kamalakaran S, Varadan V, Janevski A, Banerjee N, Tuck D, McCombie WR, Dimitrova N, Harris LN. Translating next generation sequencing to practice: Opportunities and necessary steps. Mol Oncol. 2013; 7(4):743–55.
Goodwin S, McPherson JD, McCombie WR. Coming of age: ten years of next-generation sequencing technologies. Nat Rev Genet. 2016; 17(6):333–51.
O’Driscoll A, Daugelaite J, Sleator RD. Big data, hadoop and cloud computing in genomics. J Biomed Inform. 2013; 46(5):774–81.
Mardis ER. The challenges of big data. Dis Model Mech. 2016; 9(5):483–5.
Baker M. Next-generation sequencing: adjusting to data overload. Nat Methods. 2010; 7(7):495–9.
Huang BE, Mulyasasmita W, Rajagopal G. The path from big data to precision medicine. Expert Rev Precis Med Drug Dev. 2016; 1(2):129–43. doi:10.1080/23808993.2016.1157686. http://arxiv.org/abs/http://dx.doi.org/10.1080/23808993.2016.1157686
Jha A, Khan Y, Iqbal A, Zappa A, Mehdi M, Sahay R, Rebholz-Schuhmann D. Linked functional annotation for differentially expressed gene (DEG) demonstrated using illumina body map 2.0. In: Proceedings of the 8th Semantic Web Applications and Tools for Life Sciences International Conference, vol. 1546. Cambridge: CEUR-WS.org: 2015. p. 23–32.
Trapnell C, Roberts A, Goff L, Pertea G, Kim D, Kelley DR, Pimentel H, Salzberg SL, Rinn JL, Pachter L. Differential gene and transcript expression analysis of rna-seq experiments with tophat and cufflinks. Nat Protoc. 2012; 7(3):562–78.
Asmann YW, Necela BM, Kalari KR, Hossain A, Baker TR, Carr JM, Davis C, Getz JE, Hostetter G, Li X, et al.Detection of redundant fusion transcripts as biomarkers or disease-specific therapeutic targets in breast cancer. Cancer Res. 2012; 72(8):1921–8.
Ramskold D, Wang ET, Burge CB, Sandberg R. An abundance of ubiquitously expressed genes revealed by tissue transcriptome sequence data. PLoS Comput Biol. 2009; 5(12):1000598.
Crowley JJ, Zhabotynsky V, Sun W, Huang S, Pakatci IK, Kim Y, Wang JR, Morgan AP, Calaway JD, Aylor DL, et al.Analyses of allele-specific gene expression in highly divergent mouse crosses identifies pervasive allelic imbalance. Nat Genet. 2015; 47(4):353–60.
Belleau F, Nolin M, Tourigny N, Rigault P, Morissette J. Bio2rdf: Towards a mashup to build bioinformatics knowledge systems. J Biomed Inform. 2008; 41(5):706–16.
Dumontier M, Callahan A, Cruz-Toledo J, Ansell P, Emonet V, Belleau F, Droit A. Bio2rdf release 3: A larger, more connected network of linked data for the life sciences. In: Proceedings of the ISWC 2014 Posters & Demonstrations Track a Track Within the 13th International Semantic Web Conference, ISWC 2014, CEUR Workshop Proceedings, vol. 1272. Riva del Garda: CEUR-WS.org: 2014. p. 401–4.
Hu W, Qiu H, Dumontier M. Link analysis of life science linked data. In: The Semantic Web - ISWC 2015 - 14th International Semantic Web Conference, Proceedings, Part II, Lecture Notes in Computer Science, vol. 9367. Bethlehem: Springer: 2015. p. 446–62.
Ding L, Shinavier J, Shangguan Z, McGuinness DL. SameAs Networks and Beyond: Analyzing Deployment Status and Implications of owl: sameAs in Linked Data. In: The Semantic Web - ISWC 2010 - 9th International Semantic Web Conference, Revised Selected Papers, Part I, Lecture Notes in Computer Science, vol. 6496. Shanghai: Springer: 2010. p. 145–60.
Khan Y, Saleem M, Mehdi M, Hogan A, Mehmood Q, Rebholz-Schuhmann D, Sahay R. SAFE: SPARQL Federation over RDF Data Cubes with Access Control. J Biomed Semant. 2017; 8(1):5.
Carroll JJ, Bizer C, Hayes PJ, Stickler P. Named graphs, provenance and trust. In: Proceedings of the 14th international conference on World Wide Web, WWW 2005. Chiba: ACM: 2005. p. 613–22.
Schwarte A, Haase P, Hose K, Schenkel R, Schmidt M. Fedx: Optimization techniques for federated query processing on linked data. In: The Semantic Web - ISWC 2011 - 10th International Semantic Web Conference, Proceedings, Part I, Lecture Notes in Computer Science, vol. 7031. Bonn: Springer: 2011. p. 601–16.
Acosta M, Vidal M-E, Lampo T, Castillo J, Ruckhaus E. Anapsid: An adaptive query processing engine for sparql endpoints. In: The Semantic Web - ISWC 2011 - 10th International Semantic Web Conference, Proceedings, Part I, Lecture Notes in Computer Science, vol. 7031. Bonn: Springer: 2011. p. 18–34.
Saleem M, Ngomo A-CN. Hibiscus: Hypergraph-based source selection for SPARQL endpoint federation. In: The Semantic Web: Trends and Challenges - 11th International Conference, ESWC 2014, Proceedings, Lecture Notes in Computer Science, vol. 8465. Crete: Springer: 2014. p. 176–91.
Cline MS, Craft B, Swatloski T, Goldman M, Ma S, Haussler D, Zhu J. Exploring tcga pan-cancer data at the ucsc cancer genomics browser. Sci Reports. 2013; 3:2652–8.
Bindea G, Mlecnik B, Hackl H, Charoentong P, Tosolini M, Kirilovsky A, Fridman WH, Pagès F, Trajanoski Z, Galon J. Cluego: a cytoscape plug-in to decipher functionally grouped gene ontology and pathway annotation networks. Bioinformatics. 2009; 25(8):1091–3.
Bindea G, Galon J, Mlecnik B. Cluepedia cytoscape plugin: pathway insights using integrated experimental and in silico data. Bioinformatics. 2013; 26(5):661–3.
Araki K, Kawauchi K, Hirata H, Yamamoto M, Taya Y. Cytoplasmic translocation of the retinoblastoma protein disrupts sarcomeric organization. Elife. 2013; 2:01228.
Stevenson RP, Veltman D, Machesky LM. Actin-bundling proteins in cancer progression at a glance. J Cell Sci. 2012; 125(5):1073–9.
Lu H, Ouyang W, Huang C. Inflammation, a key event in cancer development. Mol Cancer Res. 2006; 4(4):221–33.
Wang Z. Protein s-nitrosylation and cancer. Cancer Lett. 2012; 320(2):123–9.
Kandoth C, McLellan MD, Vandin F, Ye K, Niu B, Lu C, Xie M, Zhang Q, McMichael JF, Wyczalkowski MA, et al.Mutational landscape and significance across 12 major cancer types. Nature. 2013; 502(7471):333–9.
Saleem M, Padmanabhuni SS, Ngomo A-CN, Almeida JS, Decker S, Deus HF. Linked cancer genome atlas database. In: I-SEMANTICS 2013 - 9th International Conference on Semantic Systems, ISEM ’13. Graz: ACM: 2013. p. 129–34.
Zappa A, Splendiani A, Romano P. Towards linked open gene mutations data. BMC Bioinforma. 2012; 13(Suppl 4):7.
Saleem M, Padmanabhuni SS, Ngomo A-CN, Iqbal A, Almeida JS, Decker S, Deus HF. TopFed: TCGA Tailored Federated Query Processing and Linking to LOD. J Biomed Semant. 2014; 5:47.
Saleem M, Kamdar MR, Iqbal A, Sampath S, Deus HF, Ngomo A-CN. Big linked cancer data: Integrating linked tcga and pubmed. Web Semant Sci Serv Agents World Wide Web. 2014; 27:34–41.
Deng M, Brägelmann J, Schultze JL, Perner S. Web-tcga: an online platform for integrated analysis of molecular cancer data sets. BMC Bioinforma. 2016; 17(1):1.
Zimmermann P, Hirsch-Hoffmann M, Hennig L, Gruissem W. Genevestigator. arabidopsis microarray database and analysis toolbox. Plant Physiol. 2004; 136(1):2621–32.
Ainscough BJ, Griffith M, Coffman AC, Wagner AH, Kunisaki J, Choudhary MN, McMichael JF, Fulton RS, Wilson RK, Griffith OL, Mardis ER. Docm: a database of curated mutations in cancer. Nat Methods. 2016; 13(10):806–7.
Consortium TICG. International network of cancer genome projects. Nature. 2010; 464(7291):993–8.
Yeh P, Chen H, Andrews J, Naser R, Pao W, Horn L. Dna-mutation inventory to refine and enhance cancer treatment (direct): A catalog of clinically relevant cancer mutations to enable genome-directed anticancer therapy. Clin Cancer Res Off J Am Assoc Cancer Res. 2013; 19(7):1894–901.
Stephens ZD, Lee SY, Faghri F, Campbell RH, Zhai C, Efron MJ, Iyer R, Schatz MC, Sinha S, Robinson GE. Big data: Astronomical or genomical?. PLOS Biol. 2015; 13(7):1–11.
Lacroix Z, Murthy H, Naumann F, Raschid L. Links and paths through life sciences data sources. In: Data Integration in the Life Sciences, First International Workshop, DILS 2004, Proceedings, Lecture Notes in Computer Science, vol. 2994. Leipzig: Springer: 2004. p. 203–11.
Gao J, Aksoy BA, Dogrusoz U, Dresdner G, Gross B, Sumer SO, Sun Y, Jacobsen A, Sinha R, Larsson E, et al.Integrative analysis of complex cancer genomics and clinical profiles using the cbioportal. Sci Signal. 2013; 6(269):1–1.
Acknowledgment
This article is based on a conference paper discussed at the SWAT4LS 2015, Cambridge, UK [10].
Funding
This publication has emanated from research supported by the research grant from Science Foundation Ireland (SFI) under Grant Number SFI/12/RC/2289.
Author information
Authors and Affiliations
Contributions
AJ designed the study and helped in RDF data conversion, analysis and concluding domain results. YK designed and implemented the query federation and RDF conversion. MM and QM discovered the links across cancer repositories. RK contributed to RDF data conversion and raw data processing. AZ critically revised the manuscript. DR and RS have jointly supervised the article. All authors read and approved the final manuscript.
Corresponding author
Ethics declarations
Ethics approval and consent to participate
Not applicable.
Consent for publication
Not applicable.
Competing interests
The authors declare that they have no competing interests.
Publisher’s Note
Springer Nature remains neutral with regard to jurisdictional claims in published maps and institutional affiliations.
Additional information
Availability of data and materials
The BIOOPENER online demonstration website http://bioopenerproject.insight-centre.org/is available for the scientific uses and the relevant datasets (in RDF) shown in the Table 1 are available at http://bioopenerfiles.insight-centre.org/.
Rights and permissions
Open Access This article is distributed under the terms of the Creative Commons Attribution 4.0 International License (http://creativecommons.org/licenses/by/4.0/), which permits unrestricted use, distribution, and reproduction in any medium, provided you give appropriate credit to the original author(s) and the source, provide a link to the Creative Commons license, and indicate if changes were made. The Creative Commons Public Domain Dedication waiver(http://creativecommons.org/publicdomain/zero/1.0/) applies to the data made available in this article, unless otherwise stated.
About this article

Cite this article
Jha, A., Khan, Y., Mehdi, M. et al. Towards precision medicine: discovering novel gynecological cancer biomarkers and pathways using linked data. J Biomed Semant 8, 40 (2017). https://doi.org/10.1186/s13326-017-0146-9
Received:
Accepted:
Published:
DOI: https://doi.org/10.1186/s13326-017-0146-9